Introduction
With data revealing that over $4.1 billion was lost to DeFi hacks in 2024, the cryptocurrency landscape continues to evolve rapidly. Among the various phenomena within this dynamic environment, the Bitcoin halving event remains one of the most significant occurrences for investors and traders alike. This article sheds light on Bitcoin halving technical indicators, providing insights that can guide your trading strategies as we approach 2025 and beyond.
What is Bitcoin Halving?
Bitcoin halving is an event that occurs approximately every four years, specifically after every 210,000 blocks are mined. During this event, the reward that miners receive for adding a new block to the blockchain is cut in half. This decrease in reward is significant because it effectively reduces the supply of Bitcoin entering circulation.
For instance, during the first halving in 2012, the mining reward decreased from 50 BTC to 25 BTC, then to 12.5 BTC in 2016, and most recently to 6.25 BTC in the 2020 halving. The next halving is anticipated to reduce the reward to 3.125 BTC, thus affecting supply dynamics and potentially leading to price changes.

The Importance of Technical Indicators
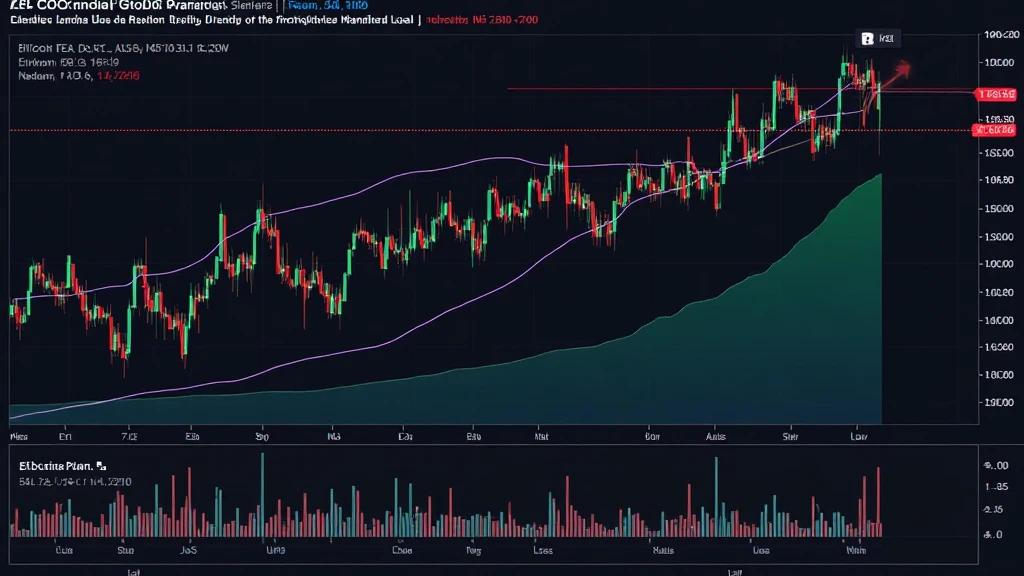
Understanding technical indicators is essential for traders looking to make informed decisions based on price movements. These indicators help in analyzing historical data and predicting future price trends. In the context of Bitcoin halving, several technical indicators can be particularly useful.
1. Moving Averages (MA)
Moving averages smooth out price data to identify trends over a specific period. A common strategy involves observing the crossover between short-term and long-term moving averages.
- Simple Moving Average (SMA): Calculating the average price over a set number of days.
- Exponential Moving Average (EMA): Gives more weight to recent prices, making it more reactive than SMA.
2. Relative Strength Index (RSI)
The RSI measures the speed and change of price movements, providing insights into overbought or oversold conditions within the market. An RSI above 70 might indicate overbought conditions, while an RSI below 30 could indicate oversold conditions.
3. Bollinger Bands
Bollinger Bands consist of a middle band (SMA) and two outer bands that measure price volatility. The space between the bands expands or contracts based on market volatility, making it useful to identify potential breakout points.
4. Fibonacci Retracement Levels
Fibonacci retracement levels are critical for identifying key support and resistance levels. Traders often utilize these levels to set target prices or stop-loss orders when attempting to capitalize on price movements following the halving event.
Impact of Bitcoin Halving on Market Sentiment
Investors’ sentiments can shift dramatically around halving events. Historical data suggests that halving events often lead to bullish trends. For instance, after the 2012 halving, Bitcoin’s price experienced a significant uptrend, reaching new all-time highs by 2013. Similarly, the 2016 halving was followed by widespread adoption and significant price increases.
Case Study: Bitcoin Halving and Market Trends
Let’s analyze the patterns of price movements following previous halving events:
| Event | Date | Price before Halving | Price after Halving (1 Year) |
|---|---|---|---|
| First Halving | November 28, 2012 | $12 | $1,200 |
| Second Halving | July 9, 2016 | $650 | $20,000 |
| Third Halving | May 11, 2020 | $8,500 | $64,000 |
As we approach the next halving in 2024, analyzing these trends can provide valuable insights for traders preparing for price movements in 2025.
Local Market Insights: Bitcoin in Vietnam
In Vietnam, the crypto market has witnessed significant growth, reflected in the increasing number of users seeking information on digital assets. Recent reports indicate that the number of Vietnamese crypto users has surged by approximately 300% in the past year alone, highlighting a robust interest in Bitcoin and altcoins.
According to a survey, around 47% of respondents were familiar with Bitcoin halving, signifying a growing awareness of critical market events that can impact trading strategies.
Key Takeaways for Investors
Investing around Bitcoin halving events can be a double-edged sword. While historical trends indicate potential price spikes, it’s essential to consider market sentiment, external economic factors, and technical indicators before making decisions. Here are some practical takeaways:
- Stay updated with historical data and patterns associated with halving events.
- Utilize technical indicators to identify potential entry and exit points.
- Monitor market sentiment and be aware of external factors that may influence Bitcoin prices.
Conclusion
Bitcoin halving events are pivotal moments in the cryptocurrency market, influencing price trends and investor sentiment. By understanding and utilizing Bitcoin halving technical indicators, traders can position themselves strategically as we approach 2025, navigating the complexities of the crypto atmosphere with confidence. Remember always to combine technical indicators with thorough market analysis for the best outcomes in your trading strategies.
As you embark on your investment journey, keep an eye on how these indicators affect Bitcoin prices, especially within local markets like Vietnam, where interest continues to rise. For more information on cryptocurrency trading strategies and insights, visit hibt.com.
Author: Dr. Alex Tran, a leading cryptocurrency analyst, has published over 20 papers in blockchain technology and has led audits for several prominent projects.


